The abrupt turnaround in interest rates since mid-2022 prompted investors to increasingly favour traditional fixed-income investments.

07.08.2023
Liquid alternatives in the first half of 2023: significant outflows despite positive performance
SUMMARY
Investors continued to make withdrawals from the UCITS-compliant hedge fund strategy segment in 2023. Outflows surged to EUR 19.4 billion as of 30 June, already surpassing the previous year’s total outflows (EUR 17.6 billion) by the mid-year mark. It is now clear that the return of higher interest rates is shifting the focus back onto traditional fixed-income investments. This is also evident in the Deutsche Bundesbank’s press release on the acquisition of financial assets, which highlights “historically high reallocations” to fixed-income investments and bonds during the first quarter of 2023. The absolute return segment suffered a particularly significant drop in volumes, recording the largest outflows in absolute terms during the first half of the year (approximately EUR 4.92 billion) despite a positive average performance.
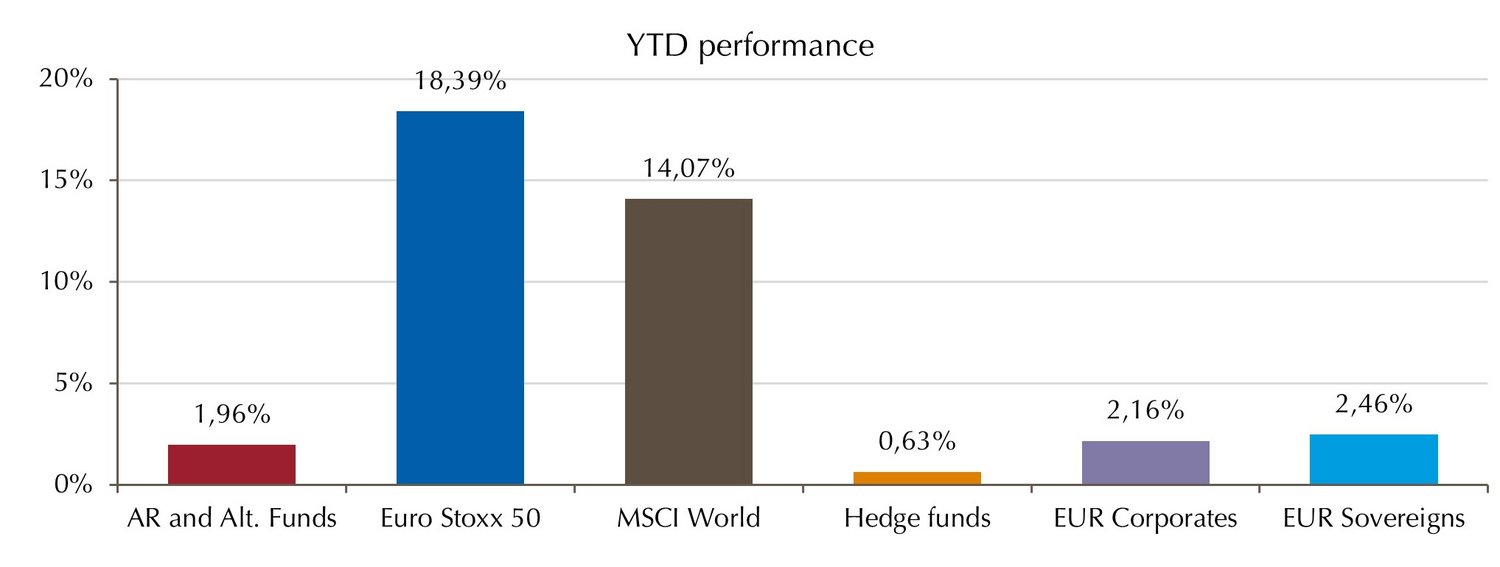
Amid a generally extremely positive market environment, the performance of 1.96% recorded by liquid alternatives strategies was roughly on a par with government and corporate bonds, lagged well behind equities, and clearly outperformed unregulated hedge funds (0.63%). As the best-performing asset class at -1.49% in 2022, this segment helped to stabilise investor portfolios.
Most strategies in this segment deliver convincing performance over a five-year period by recording significantly lower volatility compared to equities of between 5% and 15%, a feat achieved by the majority of both fixed-income and other strategies without a focus on bonds. In addition, liquid alternatives have often saved their investors from painful drawdowns, with almost three-quarters of these funds limiting their maximum losses to 20% over the past five years despite the coronavirus crisis and war in Ukraine. In the medium term, the risk-return characteristics of this segment mean it is positioned between equities and bonds.
MARKET DEVELOPMENT
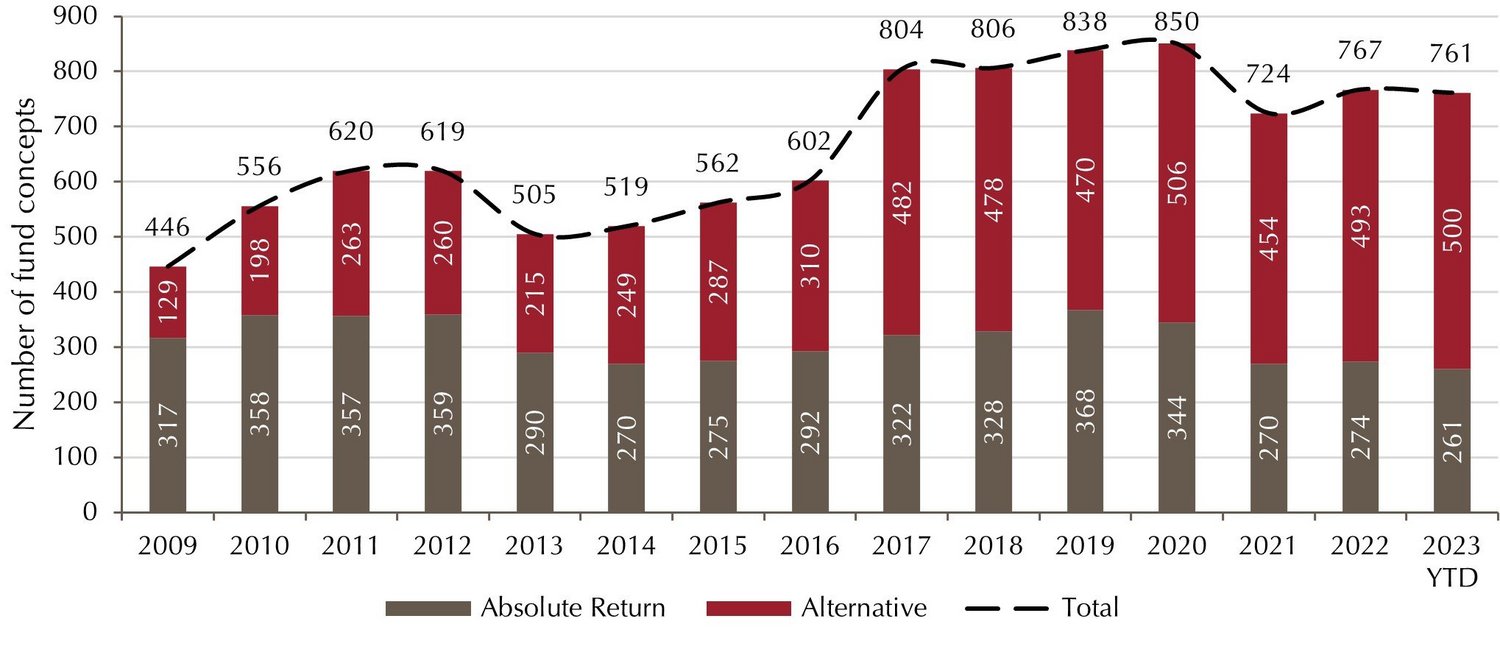
Number of fund concepts on offer remains constant
The number of fund concepts on offer in this segment remains largely unchanged compared to 2022 at 761 (2022: 767). The number of absolute return concepts fell to 261, the lowest figure since the Study began in 2008. By contrast, alternative concepts experienced modest growth to reach the 500 mark once again, with only 2020 boasting more alternative concepts (506) since the start of the Study.
Number of funds stays constant
×
![]()
After EUR 17.56 billion flowed out of the liquid alternatives universe in 2022, outflows had already reached EUR 19.42 billion during the first half of 2023. No liquid alternatives strategies recorded net inflows on an aggregated level in the first six months of the year. Overall, outflows reached EUR 28.86 billion compared to inflows of around EUR 9.44 billion. As in previous analyses, outflows were higher in March and June than in the other months, which suggests investors were reallocating funds. Outflows were relatively balanced when comparing between institutional and retail investors.
All strategies record outflows
(Basis: assets under management by strategy)

×
![]()
Alternative Multi Strategies now the largest individual strategy
Just five strategies make up over 70% of the overall market between them. Alternative Multi Strategies grew by 3.1 percentage points to become the largest individual strategy in the segment. Absolute Return lost considerable market share, shrinking by 4.3 percentage points to be knocked off top spot. Absolute Return Bond also lost market share (-1.0%). Together with Alternative Credit Focus (+2.7%), these two fixed-income strategies account for 25% market share between them. It remains to be seen whether these strategies have created a stable core, as the trend has been moving downward for some time, with both bond strategies collectively making up around 40% of the liquid alternatives asset class as recently as 2020. It is conceivable that funds could start to flow back into these strategies as soon as investors believe there will be no more interest rate hikes.
Fixed-income strategies with just under 25 percent market share once again

×
![]()
PERFORMANCE
Liquid alternatives positioned between equities and bonds in the medium to long term
Liquid alternatives recorded performance of 1.96% in the first half of the year (see “YTD performance” chart) to significantly outperform the broader index for unregulated hedge funds. While these strategies succeeded in keeping pace with government and corporate bonds, they lagged well behind European and international equities. Liquid alternatives outperform the bond markets over one, three and five years. The sharp price decline in the bond markets after the turnaround in interest rates in 2022 is also a significant factor here. Although liquid alternatives had managed to narrow the performance gap to equities in the medium term, this gap has widened significantly once again due to above-average equity performance in the first half of 2023.
Given the current market environment, it is clear that equity exposure is particularly important for performance, while liquid alternatives strategies primarily help to diversify and stabilise portfolios (see also Volatility, page 9). There are many different reasons for the low participation of liquid alternatives in strong equity markets. Many strategies invest in other asset classes besides equities, while implementing hedging components can significantly impact performance in a robust long environment. In addition, many fund managers want to decouple their investments from the wider market to a certain degree to keep their product promise of uncorrelated returns. Overall, the performance of UCITS-compliant hedge funds places them between equities and bonds in the medium term.
Liquid alternatives positioned between equities and bonds in the medium term
×
![]()
RISK ASSESSMENT
The strength of liquid alternatives lies in their ability to reduce the intensity of fluctuations within a portfolio. Over five years, most strategies in this segment succeed in keeping their volatility within a range of 5% to 15% (see chart). Average volatility across the entire segment is 9.62%, and as low as 8.4% excluding the leveraged and thus highly volatile Alternative Equity Leveraged and Alternative Short Bias strategies. Compared to traditional asset classes, volatility in the segment as a whole is close to that of European government and corporate bonds (approximately 6%) and well below the fluctuations recorded by European and international equities (EURO STOXX 19.3% p.a. and MSCI World 17.2% p.a.).
Naturally, leveraged equity strategies - the outliers from this range of moderate volatility - do not have this volatility-lowering effect on the overall portfolio. While Alternative Equity Leveraged suffered heavy losses during the coronavirus crash in particular, it generated above-average returns in the recent robust market environment, which means its volatility is high. The same logic applies to Dedicated Short Bias strategies, except for the fact that these strategies made gains during the coronavirus pandemic and relinquished some of these gains in the current environment of strong performance. There is also a significant spread of volatilities within these strategies, with some funds managing to keep volatility to only around 10% while others report fluctuations exceeding 40%. This reflects the funds’ highly divergent risk profiles. The average volatility across all strategies is around 24%.

×
![]()
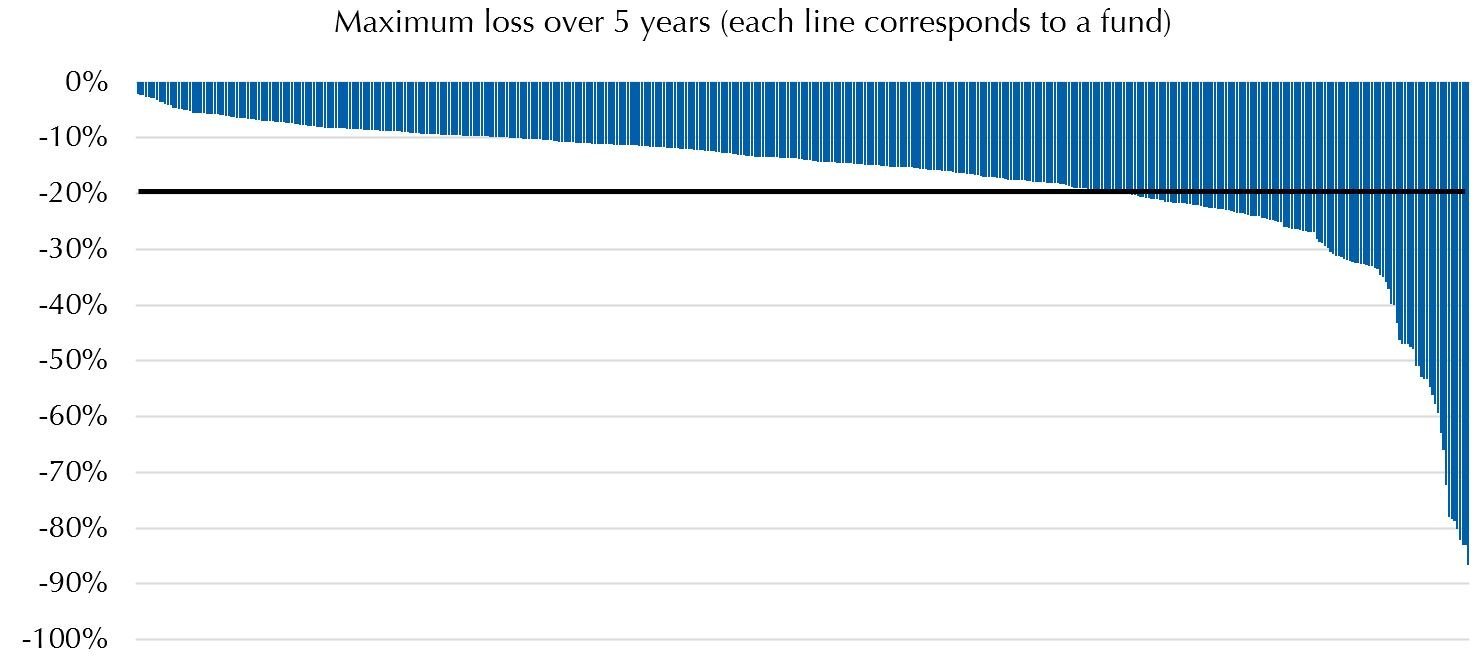
Funds effectively limit maximum losses
Over five years – that is, including the slump triggered by the coronavirus pandemic – around three quarters (73.97%) of funds managed to limit their maximum losses to 20%. The average maximum drawdown was 17.4%. In this respect, liquid alternatives can play to their strengths not only by reducing volatility but also with regard to risk control. For comparison, here are the maximum drawdowns on established market indices: EURO STOXX 50: -25.34%; MSCI World (EUR hedged): -23.10%; Hedge Funds: -7.23%; EUR Corporates: -16.65%; EUR Sovereigns: -21.25%.
The average maximum drawdown over five years was 17.4%
×
![]()
The downloadable white paper provides more data in detail, including a breakdown of the performance of each strategy.
About the Study
Since 2008, Lupus alpha has been evaluating the universe of absolute return and alternative funds on the basis of data from Refinitiv. The Study covers UCITS-compliant funds with an active management approach that are authorised for distribution in Germany. The Study focuses on market size, development and composition, performance in the investment segment and individual strategies, as well as key risk figures. It evaluates the three levels of aggregation – the overall universe, strategies within the universe, and funds within the strategies – and distinguishes between 14 strategies. The Alt. Long/Short Equity strategy, for example, is made up of 108 funds.
About Lupus alpha
As an independent, owner-operated asset management company, Lupus alpha has been synonymous with innovative, specialised investment solutions for over 20 years. As one of Germany’s European small and mid-cap pioneers, Lupus alpha is one of the leading providers of volatility strategies as well as collateralised loan obligations (CLOs). Global convertible bond strategies complete its specialised product range. The Company manages a volume of approximately EUR 13.5 billion for institutional and wholesale investors.
For further information, visit www.lupusalpha.de.
FURTHER INFORMATION