![[Translate to English:]](/fileadmin/Bilder_News/Studie_2026/Liquid_Alternatives-Header-New-Web.png "[Translate to English:]")
- Liquid alternative funds recorded net inflows of €21.5 billion in the first half of the year.
- This means that more than 80% of the total net inflows for 2025 have already been achieved.
- Assets under management rose to a record level of €296.4 billion.
- The funds generated an average return of 4.16%.
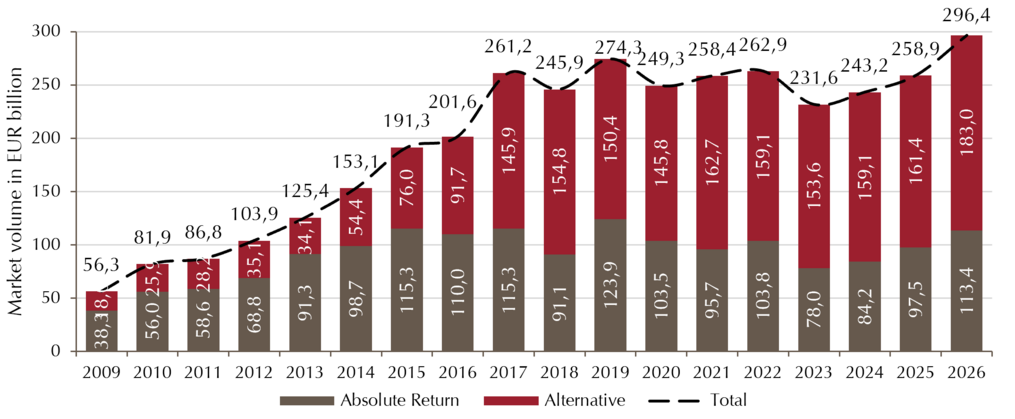
Liquid Alternative strategies within a UCITS wrapper managed more capital in the first half of 2026 than ever before: with a market volume of EUR 296.4 billion, the asset class exceeded its previous record high from 2019 (EUR 274.3 billion) for the first time. Compared to the end of 2025, this represents an increase of EUR 37.5 billion, or 14.5%. This development was driven by sustained strong net inflows and solid performance. The turnaround initiated in 2024 and confirmed in 2025 has thus solidified into a structural upswing, and the confidence crisis of the 2022/2023 rate-hike years has been overcome. For the first time since 2022, the number of funds also grew again, rising by 14 to 727.
Net inflows accelerated: over six months, the segment received EUR 21.5 billion in net inflows – already more than 80% of the entire record year 2025 (EUR 26.4 billion). Demand was exceptionally broad-based: every month of the half-year recorded positive net flows, and 13 of the 15 strategies attracted net inflows. The largest inflows again went to Absolute Return Bond (+EUR 8.7 billion). Institutional share classes accounted for around 60% of inflows; their share of market volume is back above half of the segment at 50.1%. At the same time, concentration increased: 70.1% of inflows went to the largest 5% of funds alone.
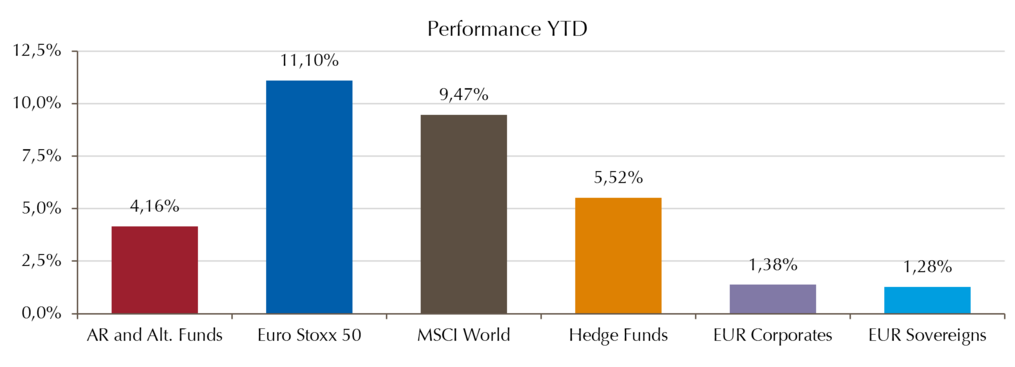
Performance was equally strong: on average across all funds, Liquid Alternatives achieved a return of 4.16% in the first half of 2026 (H1 2025: –1.87%). 83.4% of funds posted a positive result. The asset class thus positioned itself in its classic role between equities (MSCI World, EUR-hedged +9.47%) and euro government bonds (+1.28%). Over the longer term too, the segment impresses with 6.40% p.a. over three years and 5.08% p.a. over five years – clearly ahead of euro government bonds, which still have not recouped losses from the 2022 rate-hike year.
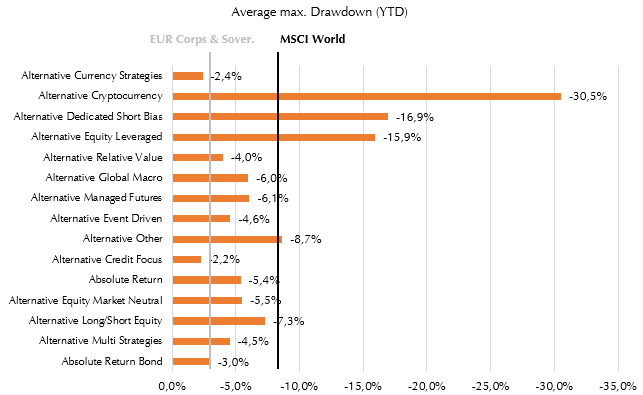
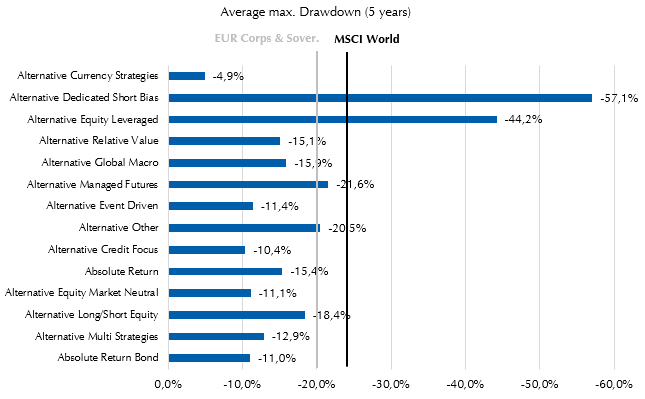
In periods of weakness, Liquid Alternatives demonstrated their stabilising effect: 11 of the 15 strategies kept their average maximum losses below the maximum drawdown of the MSCI World. The most defensive profiles were again the two fixed-income strategies Alternative Credit Focus (–2.2%) and Absolute Return Bond (–3.0%). Over five years too, 12 of the 14 strategies with a five-year history show lower maximum losses than global equities.
Absolute Return gains breadth again
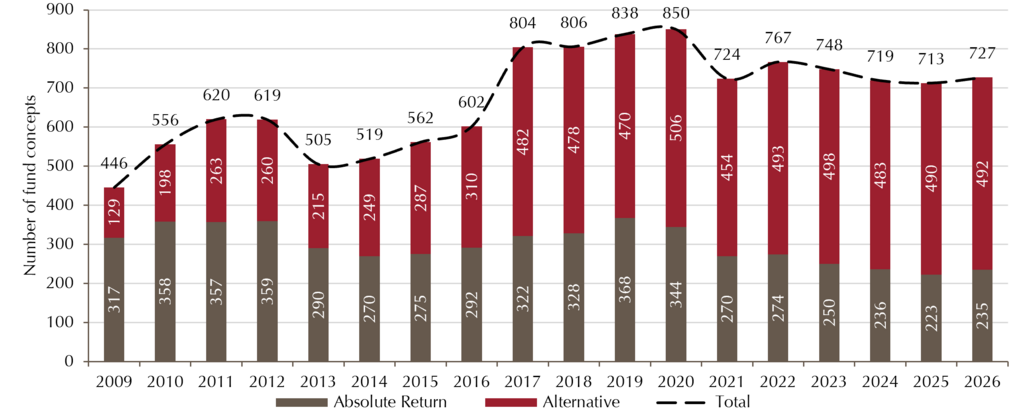
The number of funds in the investment universe examined rose by 14 to 727 in the first half of the year. This means the segment recorded growth again for the first time since 2022. 30 new funds came to market, while 16 left the data set. A trend reversal is evident in the development of the two major sub-segments: while Alternatives concepts remained almost unchanged at 492 funds, the number of Absolute Return concepts rose for the first time in four years, up 12 to 235 funds (+5.4%). The ratio of roughly one-third Absolute Return to two-thirds Alternatives thus remains in place.
The number of funds picks up again
Market volume reaches an all-time high
The market volume of Liquid Alternatives rose by EUR 37.5 billion in the first half of the year to EUR 296.4 billion (+14.5%), marking an all-time high. For the first time, the asset class has exceeded its previous record high from 2019 (EUR 274.3 billion). As recently as the end of 2023, at the low point after the rate-hike turn, the segment managed EUR 231.6 billion. Within two and a half years, the volume has thus grown by around EUR 65 billion (28%).
Both sub-segments contributed to this growth: Absolute Return funds rose by EUR 16.0 billion to EUR 113.4 billion (+16.4%), while Alternatives concepts rose by EUR 21.5 billion to EUR 183.0 billion (+13.3%). The increase was fuelled both by net inflows (EUR 21.5 billion) and by positive performance of the investment segment (4.16%).
This development shows that Liquid Alternatives have not only recovered from the confidence crisis of the 2022/2023 rate-hike years but have cemented their role in investors’ strategic asset allocation. Given persistently high equity market valuations and diverse geopolitical uncertainties, investors are evidently increasingly turning to strategies with high diversification potential.
The trough after the rate-hike turn has been overcome
Absolute Return grows faster
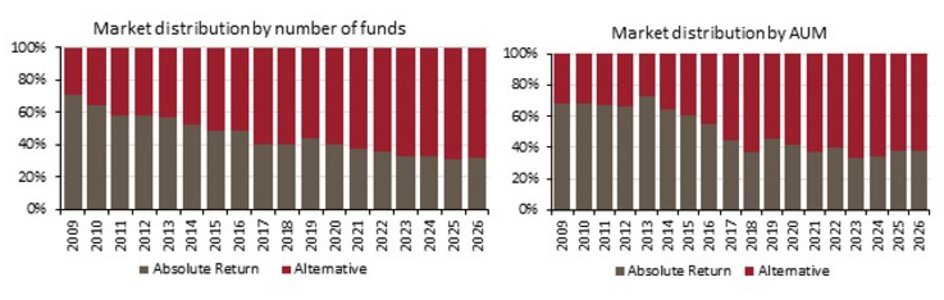
In terms of market distribution, the trend observed since 2024 continues: Absolute Return strategies keep expanding their share of assets under management – from 34.6% (2024) to now 38.3%. Measured by fund numbers, however, the ratio remains stable at around one-third Absolute Return to two-thirds Alternatives. Absolute Return funds are thus on average significantly larger and growing faster. This reflects strong demand for concepts aiming for consistently positive returns.
Alternatives dominance persists
Institutional share classes back above the 50% mark
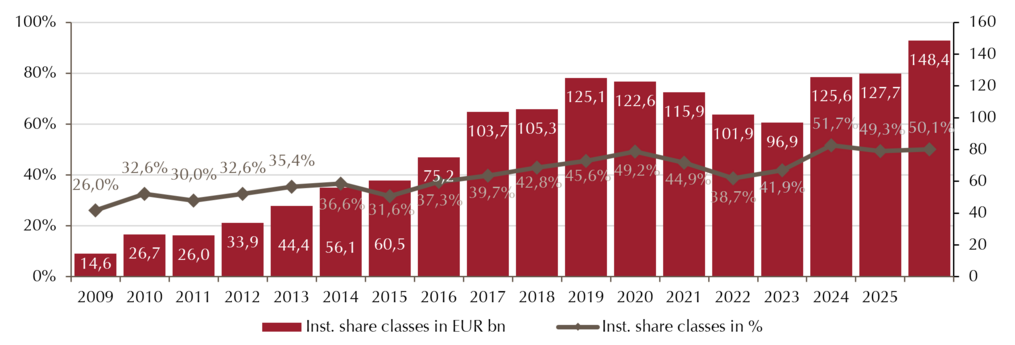
Assets under management in institutional share classes rose by EUR 20.7 billion in the first half of the year to a record EUR 148.4 billion (+16.2%). Institutional investors thus once again account for more than half of market volume, at 50.1% – up from 49.3% at the end of 2025 and the previous high of 51.7% at the end of 2024. Non-institutional volume also grew strongly, by 12.8% (+EUR 16.8 billion), so the shift in market shares is moderate: the upswing in the asset class is being carried by both investor groups.
Within the institutional segment, EUR 58.1 billion is attributable to Absolute Return concepts and EUR 90.4 billion to Alternatives. Both sub-segments recorded growth of around 16% compared to the end of 2025.
Institutional market volume reaches a new high
Strong momentum accelerates further
Following the turnaround in the second half of 2024 and the previous record year 2025 (EUR 26.4 billion in net inflows), momentum has picked up further: by the end of June, the asset class had received EUR 21.5 billion in net inflows – already more than 80% of the entire prior-year volume. The segment recorded net inflows in every one of the six months of the first half-year. This underscores the trend that emerged in the previous year: investors are returning to this asset class on a sustained basis.
Broad-based demand: 13 of 15 strategies with net inflows
Investor demand is broadly spread: 13 of the 15 strategies recorded net inflows, with only two experiencing minor outflows – Alternative Event Driven (–EUR 0.70 billion) alongside Alternative Equity Leveraged (–EUR 0.32 billion). Absolute Return Bond remains at the top with inflows of EUR 8.7 billion (+13.6%). It is followed by Alternative Long/Short Equity and Alternative Equity Market Neutral, two equity strategies with controlled market risk.
Net fund flows by strategy (in EUR billion)

Fixed Income, with the two strategies Absolute Return Bond and Alternative Credit Focus, attracted EUR 9.3 billion and remained the most important driver of inflows. At the same time, the strong demand for Equity Market Neutral, Long/Short Equity and Managed Futures shows that investors are broadening their allocation beyond pure fixed-income strategies.
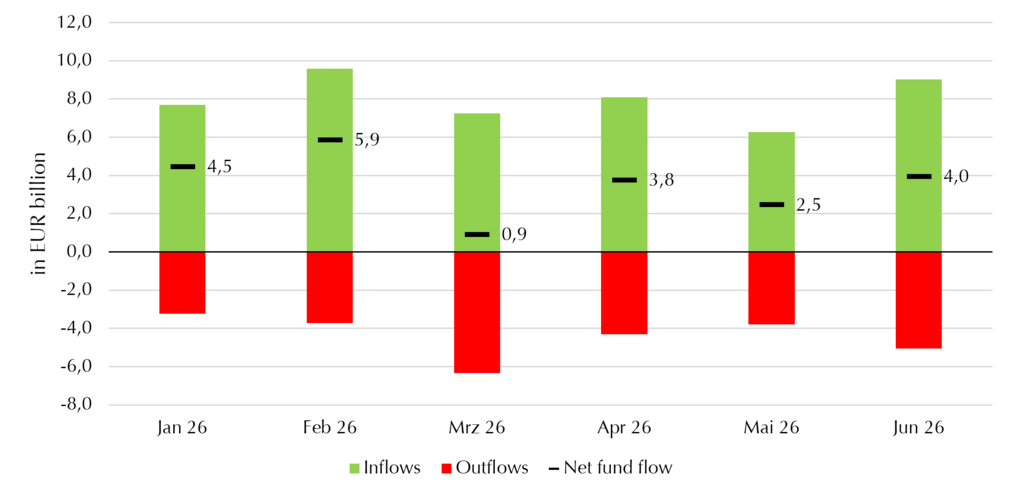
The following chart illustrates the net effects by month. In total, the Liquid Alternatives segment received gross inflows of EUR 47.9 billion in new money (green bars), while EUR 26.5 billion flowed out (red bars). This results in net inflows of EUR 21.5 billion. A notable feature across the individual months of the first half-year is the comparatively strong outflows in March. Even though Liquid Alternatives tend to offer a more defensive risk profile than classic long-only strategies, investors temporarily reduced their risk positions after the outbreak of the war in the Middle East due to increased market uncertainty.
Strong net inflows with a small dip in March
Institutional investors dominate inflows
Of the net inflows in the first half of the year, around EUR 13.0 billion (60.4%) went to institutional and EUR 8.5 billion (39.6%) to non-institutional share classes. Institutional investors are thus driving the upswing more strongly than in the second half of 2025, when both groups were roughly level. At the strategy level, institutional investors again focused on Absolute Return Bond (+EUR 5.1 billion) and Alternative Equity Market Neutral (+EUR 2.5 billion).
Inflows more strongly concentrated among a few providers
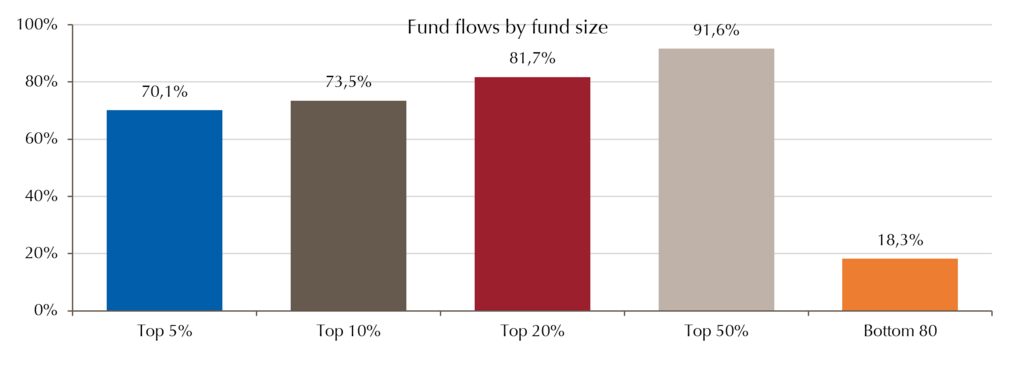
Even more than in the previous year, inflows benefited large providers: 70.1% of net inflows in the first half of the year went to the top 5% of funds by volume alone (full-year 2025: 44.2%). The top 20% attracted 81.7% of inflows, while the lower half of the universe received 8.4%. The upswing in the asset class is thus also a process of concentration: investors prefer to allocate to established, high-volume products with a long track record. This once again highlights the limited market penetration of smaller providers.
Dominant market leaders with even higher inflows
High market concentration remains a defining feature of the segment
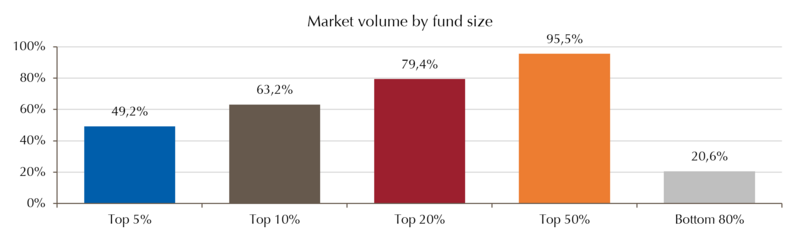
The already high concentration among providers has increased further: the largest 5% of funds now manage 49.2% of total market volume (full-year 2025: 47.4%) – more than double the smallest 80% (20.6%). Fund sizes underline this picture: 90.5% of all funds manage less than EUR 1 billion, and 80.0% even less than EUR 500 million. Of the 727 funds in total, only 64 manage more than EUR 1 billion.
Market concentration continues to increase
Absolute Return Bond extends its lead – Equity Market Neutral overtakes Credit Focus
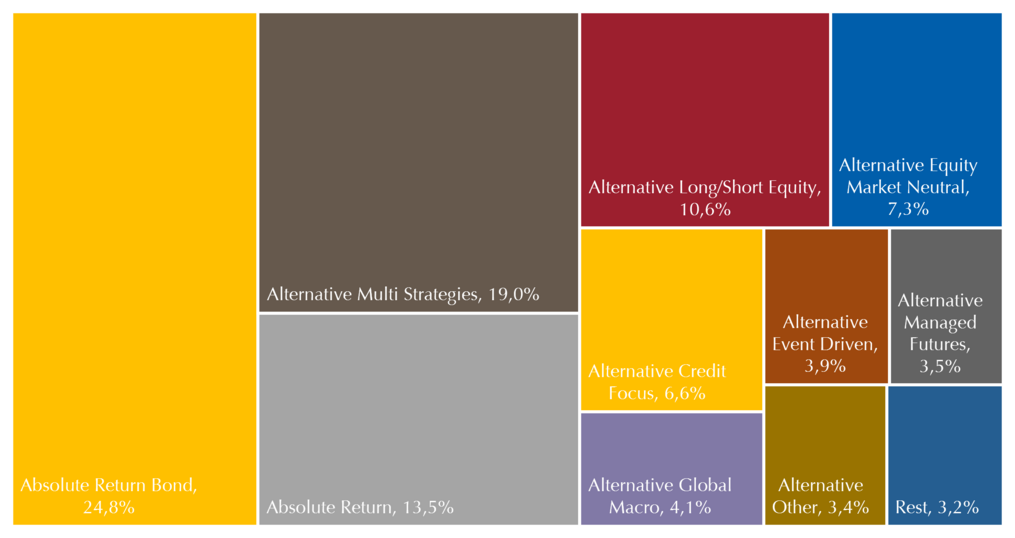
Absolute Return Bond remains by far the largest strategy in the investment universe examined, with a market share of 24.8% (end of 2025: 24.2%), and continues to extend its leading position. It is followed by Alternative Multi Strategies at 19.0% (20.2%) and Absolute Return at 13.5% (unchanged). The two fixed-income strategies Absolute Return Bond and Alternative Credit Focus together account for 31.4% of market volume, underscoring the central role of defensive bond strategies in the segment.
The three largest strategies account for almost 60% of assets in the asset class
Strong half-year: 4.16% on average across all funds
After a mixed 2025 (first half –1.87%, full-year +1.99%), which was weighed down in part by the historic dollar weakness, Liquid Alternatives bounced back in 2026: 83.4% of funds closed the first half of the year with a positive result. On average across all funds, the asset class achieved a performance of 4.16% in the first half of the year.
H1 2026 performance raises expectations

Convincing figures over the medium and long term too
Solid performance over 3 years (each as of 30 June)
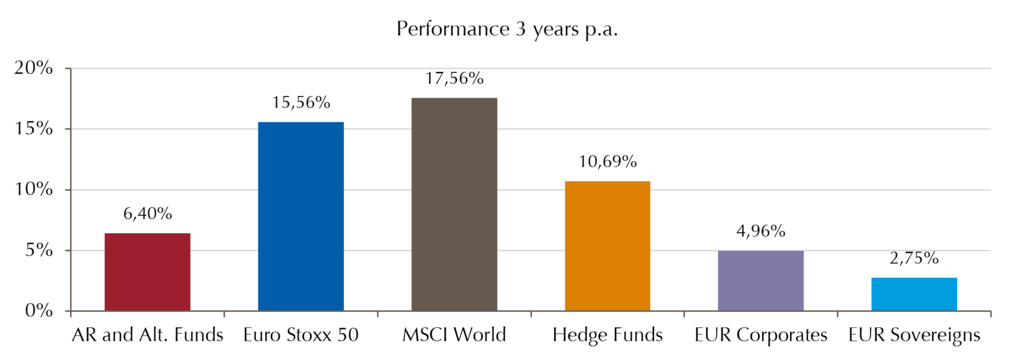
Over the longer observation periods, the asset class underscores its role in the portfolio: the share of funds with positive performance stands at 88.2% over one year, 91.2% over three years and 89.2% over five years. Over three years, Liquid Alternatives achieved a return of 6.40% p.a., clearly ahead of euro corporate bonds (4.96% p.a.) and euro government bonds (2.75% p.a.).
Clearly ahead of euro bonds over five years
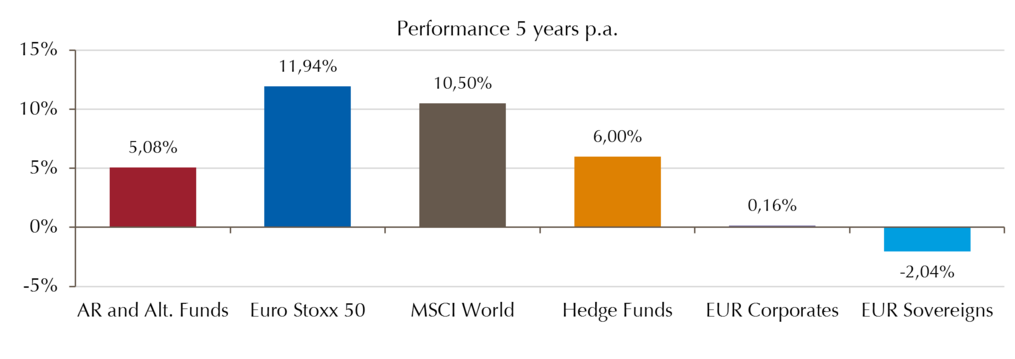
Over five years too, Liquid Alternatives confirm their stabilising role between traditional asset classes: with a return of 5.08% p.a., they are only narrowly behind unregulated hedge funds (6.00% p.a., in USD), but clearly ahead of euro corporate bonds (0.16% p.a.) and euro government bonds, which at –2.04% p.a. still have not recouped price losses from the 2022 rate-hike year. As expected, the hedge fund strategies within a UCITS wrapper do not match the above-average performance of equity markets – Euro Stoxx 50 at 11.94% p.a. and MSCI World (EUR-hedged) at 10.50% p.a. – though this comes with significantly lower maximum losses (see risk assessment).
On par with unregulated hedge funds over the long term (30 June)
Trend followers stage a comeback – leveraged strategies again at the extremes
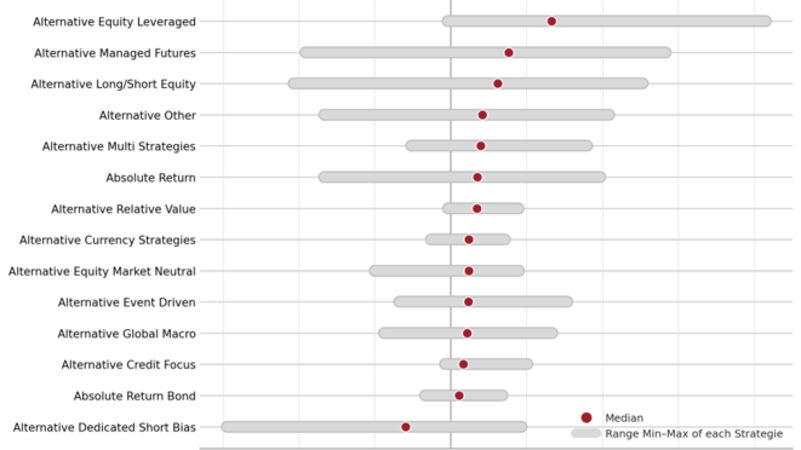
At the level of individual strategies, the usual wide range of performance is evident. Alternative Managed Futures achieved the best half-year result of all unlevered strategies with a median return of 7.7%, marking a comeback after a weak 2025. Trend-following models were evidently able to successfully capture the market movements of the half-year. As expected, the two leveraged strategies mark the poles of the spectrum: Alternative Equity Leveraged reached a median of +13.3% (best fund: +41.5%), while Alternative Dedicated Short Bias brought up the rear with a median of –5.9%.
The fixed-income strategies delivered solid but largely unspectacular results: Alternative Credit Focus achieved a median of +1.7%, Absolute Return Bond +1.1% – both with the usual narrow dispersion: for Absolute Return Bond, the best fund (+6.8%) and weakest fund (–3.4%) are just over ten percentage points apart. At the other end of the dispersion scale are Alternative Managed Futures (–19.1% to +28.3%) and Alternative Long/Short Equity (–20.7% to +25.3%), with ranges of more than 45 percentage points. The wide dispersion within strategies once again underscores how crucial careful fund selection is for investment success.
Dispersion within the strategy in H1 2026
Drawdowns lower than in the equity market
The risk assessment for the first half of the year also confirms the strengths of the asset class: 11 of the 15 strategies kept their average maximum losses below the drawdown of the MSCI World (EUR-hedged: –8.5% year to date). The smallest setbacks were recorded by the two fixed-income strategies Alternative Credit Focus (–2.2%) and Absolute Return Bond (–3.0%), as well as Alternative Currency Strategies (–2.4%). They are thus at a similar level to euro bonds (–3.0%). As expected, significantly higher maximum losses were seen in the two leveraged strategies Alternative Equity Leveraged and Alternative Dedicated Short Bias, as well as Alternative Cryptocurrency.
Almost all strategies were able to effectively limit their drawdowns in the first half of the year
Drawdown-adjusted returns reveal clear clusters
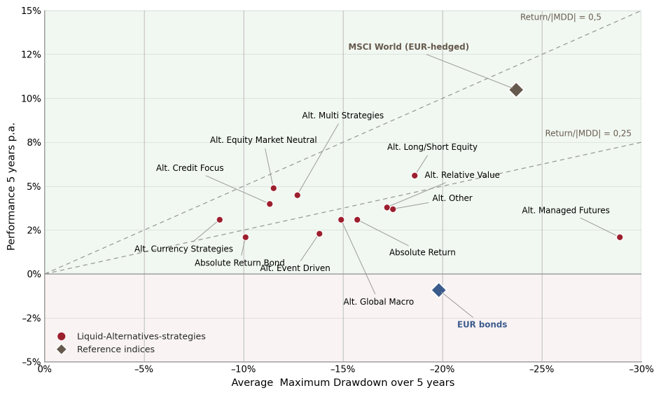
The chart plots the average annual return of the past five years against the average maximum drawdown. The dashed lines mark different ratios of return to maximum drawdown. A value of 0.5, for example, means that a return of 10% p.a. is offset by a maximum drawdown of 20%. In other words, one percentage point of annual return in this case costs two percentage points of maximum drawdown.
The MSCI World (EUR-hedged) achieves a ratio of just under 0.5, with a return of around 10.5% against a maximum loss of about 24%, setting a demanding reference point. A cluster with a comparatively favourable ratio of return to maximum drawdown is formed by the three strategies Alternative Multi Strategies, Alternative Equity Market Neutral and Alternative Credit Focus. Outside the axes shown are the two leveraged strategies Alternative Dedicated Short Bias and Alternative Equity Leveraged.
Ratio of five-year return to maximum loss
Sharpe ratios: solid return-risk profile across the board
In the first half of 2026, 62.5% of funds achieved a positive Sharpe ratio. 30.3% reached a value above 1, representing a very good return-to-risk ratio. Over one year, 72.1% of funds show a positive Sharpe ratio (38.2% with a Sharpe ratio above 1), and over five years the figure is 71.1% (6.9% above 1). At the strategy level, Alternative Credit Focus (average Sharpe ratio 0.63), Alternative Equity Leveraged (0.55), Alternative Event Driven (0.44) and Alternative Equity Market Neutral (0.43) deliver the best risk-adjusted results over five years.
Since 2008, Lupus alpha has been evaluating Absolute Return and Liquid Alternatives Funds based on data from LSEG Lipper. The present study covers UCITS-compliant funds with an active management approach that are authorised for distribution in Germany. The study focuses on market size, development and composition, performance in the investment segment and individual strategies, as well as risk indicators. The three levels examined are the investment universe, strategies within the universe, and funds within the strategies. A distinction is made between 15 strategies (see glossary, page 12) with a total of 727 funds.
Disclaimer: This document serves as a study for general information purposes and is not mandatory in accordance with investment law. The information presented does not constitute an invitation to buy or sell or investment advice. It does not contain all key information required to make important economic decisions and may differ from information and estimates provided by other sources, market participants or studies. We accept no liability for the accuracy, completeness or topicality of this study. All statements are based on our assessment of the present legal and tax situation. All opinions reflect the current views of the Company and can be changed without prior notice.
Lupus alpha Investment GmbH
Speicherstraße 49–51
D-60327 Frankfurt am Main